Explanation
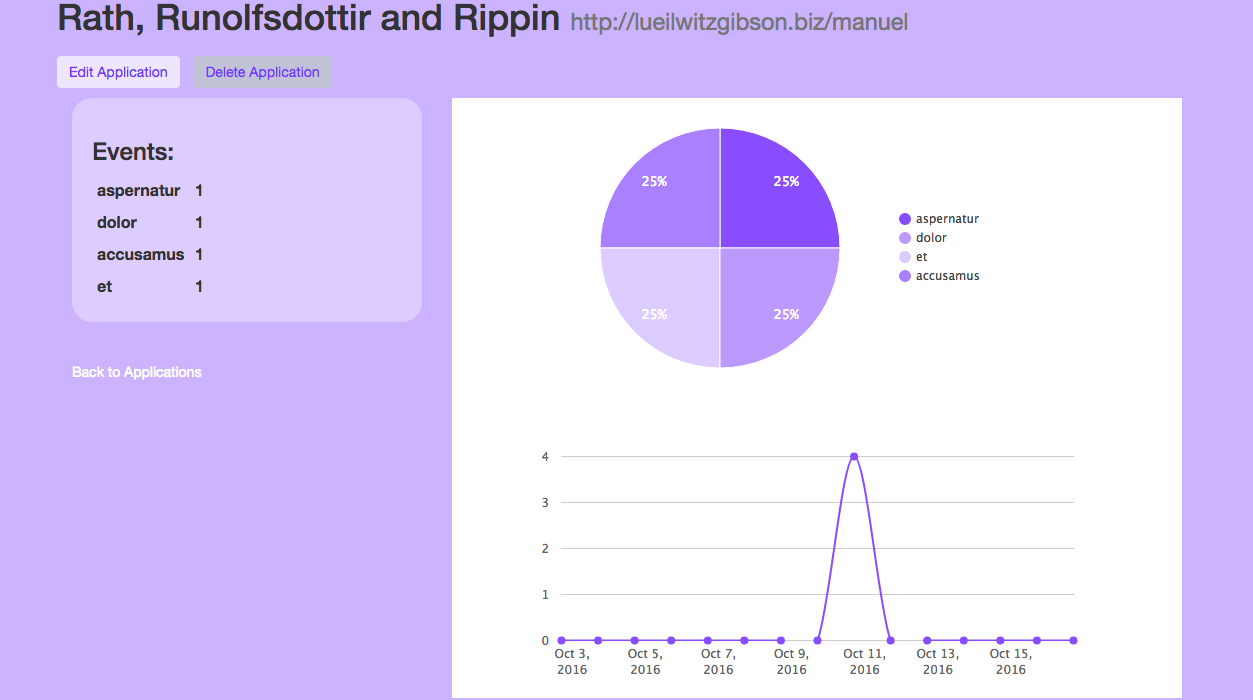
As an analytic service, this application was built to help users easily track events on their websites and to present that data through useful charts and graphs. It includes a client-side JavaScript snippet that users can add to their webpage. That snippet calls to a server-side API that captures and saves those events to a database. The application then will display those events after a user has registered their applicable websites.
Problem
Building the application from scratch, I had to initiate the application and create all of the necessary models and controllers. I needed users to be able to create accounts and subsequently login. Users needed to be able to register their websites that they wanted to track. I needed to create a model to store the trackable events and then build the API to capture and create the actual events. Finally, I needed a way to represent the data for the user in a meaningful way.
Solution
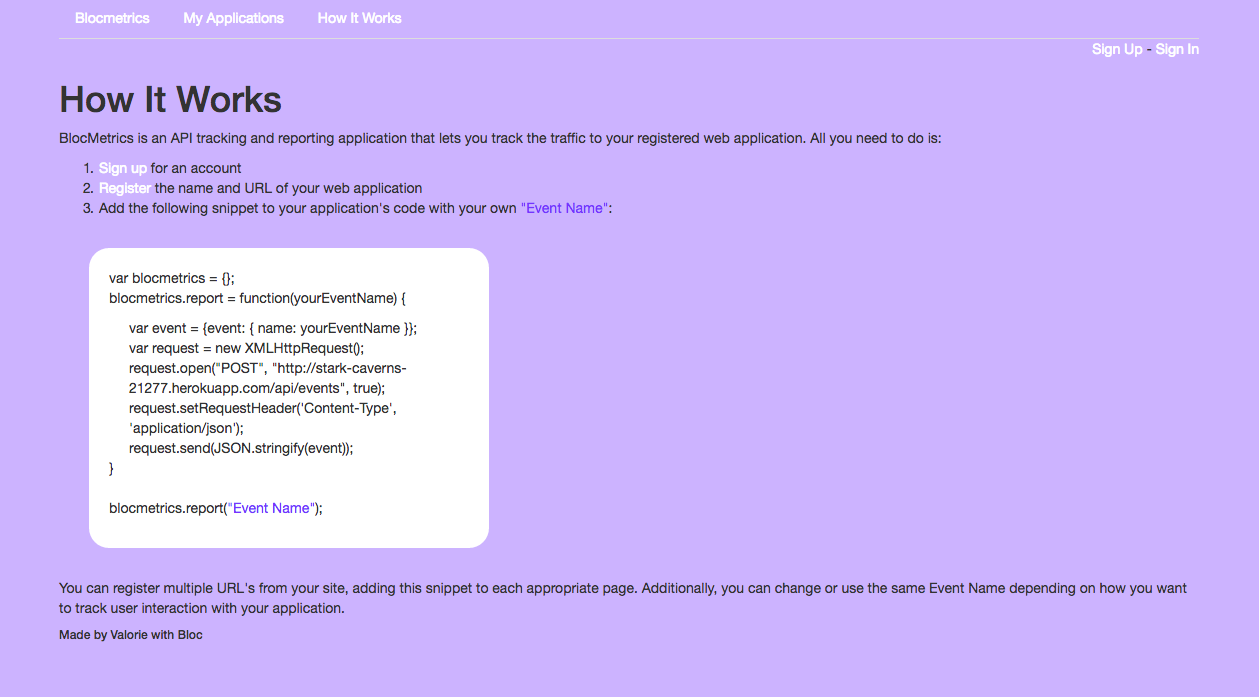
Before beginning, I organized my application with its databases to store the information I needed to build a functioning site. For my user model, I used the Ruby gem devise which was useful in authenticating users and their email addresses. I linked the API for users to include in their trackable applications
var blocmetrics = {};
  blocmetrics.report = function(eventName) {
   var event = {event: { name: eventName }};
   var request = new XMLHttpRequest();
   request.open("POST", "http://stark-caverns-21277.herokuapp.com/api/events", true);
   request.setRequestHeader('Content-Type', 'application/json');
   request.send(JSON.stringify(event));
 }

 blocmetrics.report("Event Title");
Finally, I used the JavaScript charting library, Chartkick, to display the data through graphs and charts to make it simple and quickly accessible to the user.
Results
All of the functionality of the website was developed using Test Driven Development. I wrote encompassing tests for all of the functionality of the application to ensure that it was behaving as I intended. I used curl in the terminal to test the API itself. The application was also tested locally before it was put into production on Heroku and tested for functionality there as well. Users were able to register applications and then if they successfully included the JavaScript snippet in their site, the application registered events connected to those applications that would then display for the user in the charts.
Conclusion
BlocMetrics is a simple, but useful analytics service to track basic events on websites through the use of an API. The layout and design are very basic and are definitely areas for improvement. Additionally, adding some sort of verification when users register an application would be significant in assuring that the domain is correct and accessible and that events are being registered.